SAP Extract Forecasting Parameters (MPOP Structure)
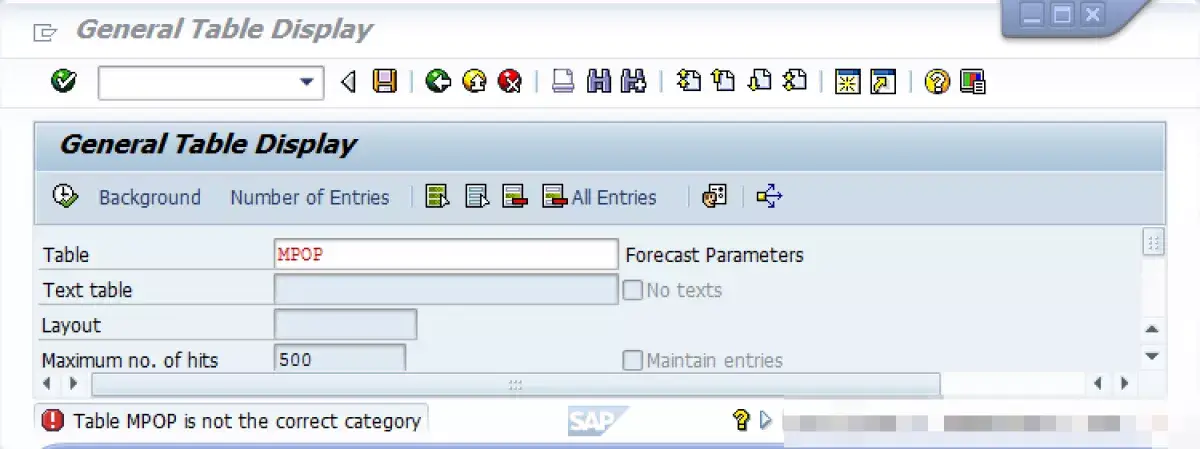
SAP MPOP structure is not a real table, and is not directly accessible, for example using SE16N (Fig 1).
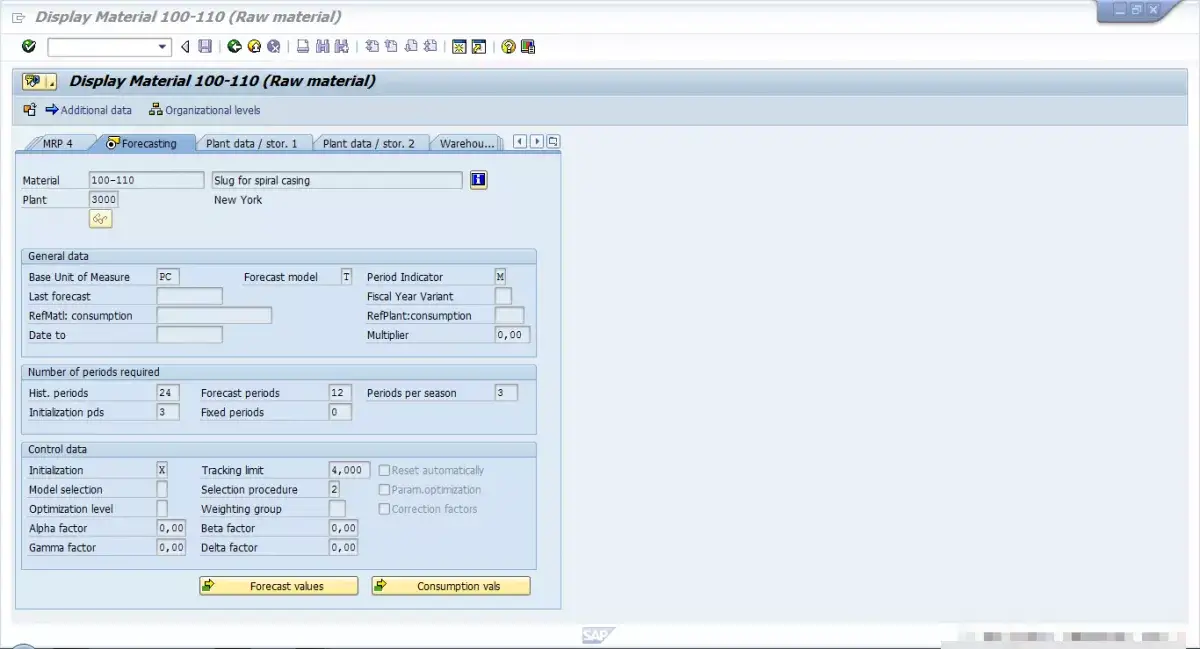
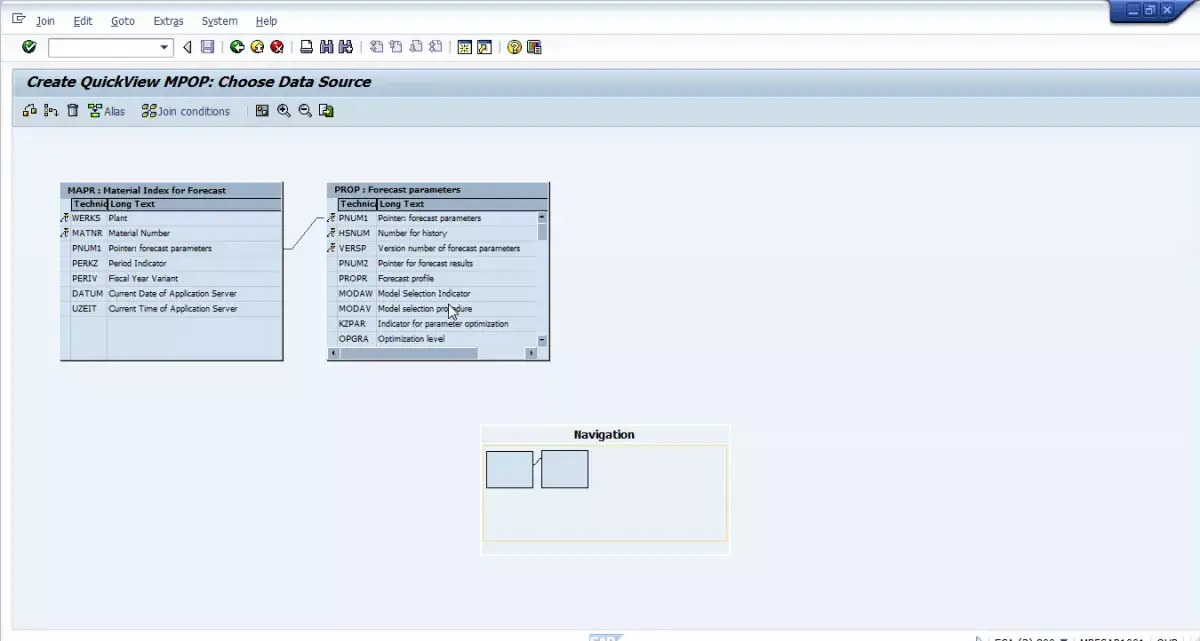
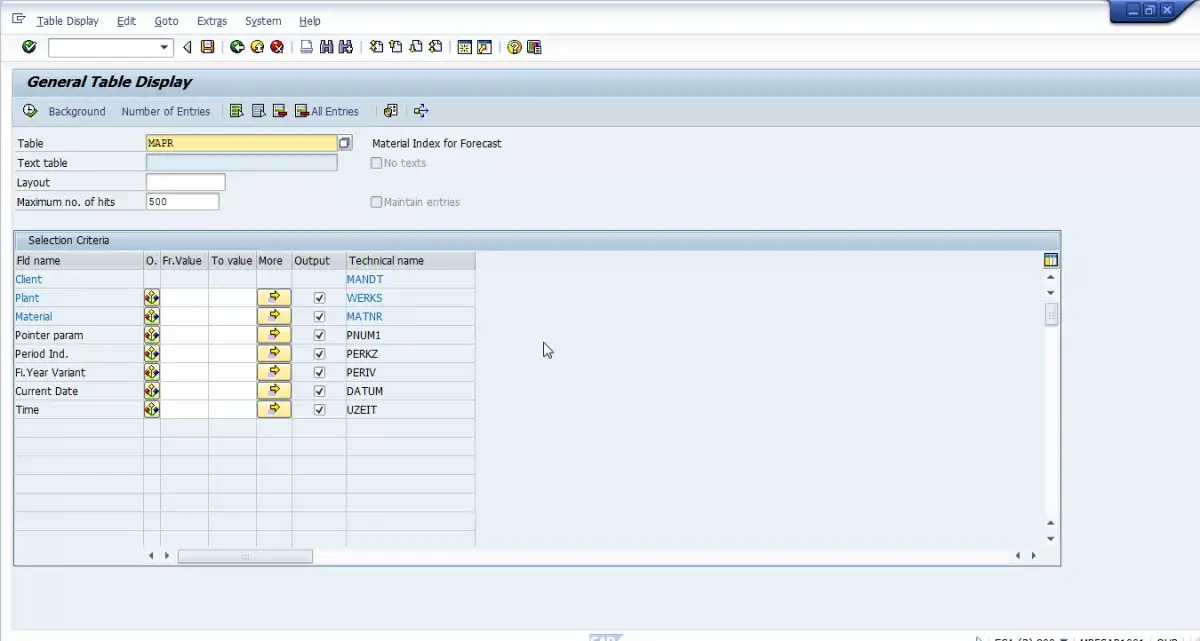
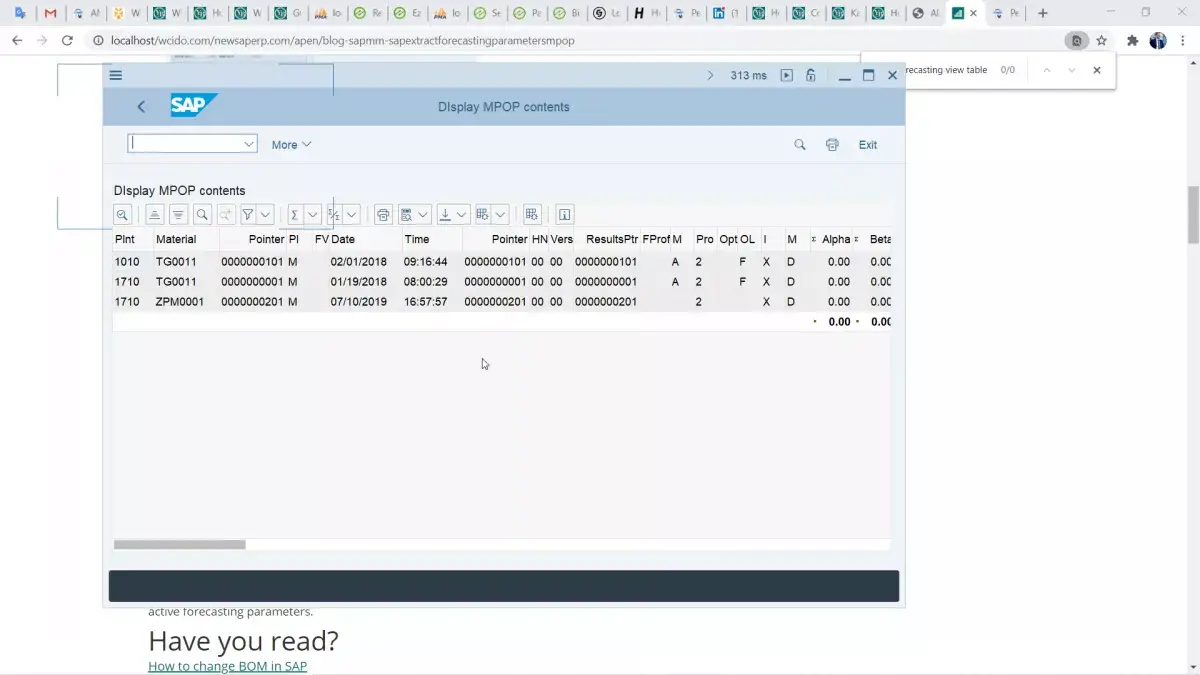
Therefore, if we want to extract Material Master’s MPOP data for a given set of materials, it must be done by accessing several tables, MAPR (Fig 2) and PROP (Fig 3), which contains information from the Material Master’s Forecasting view (Fig 4).
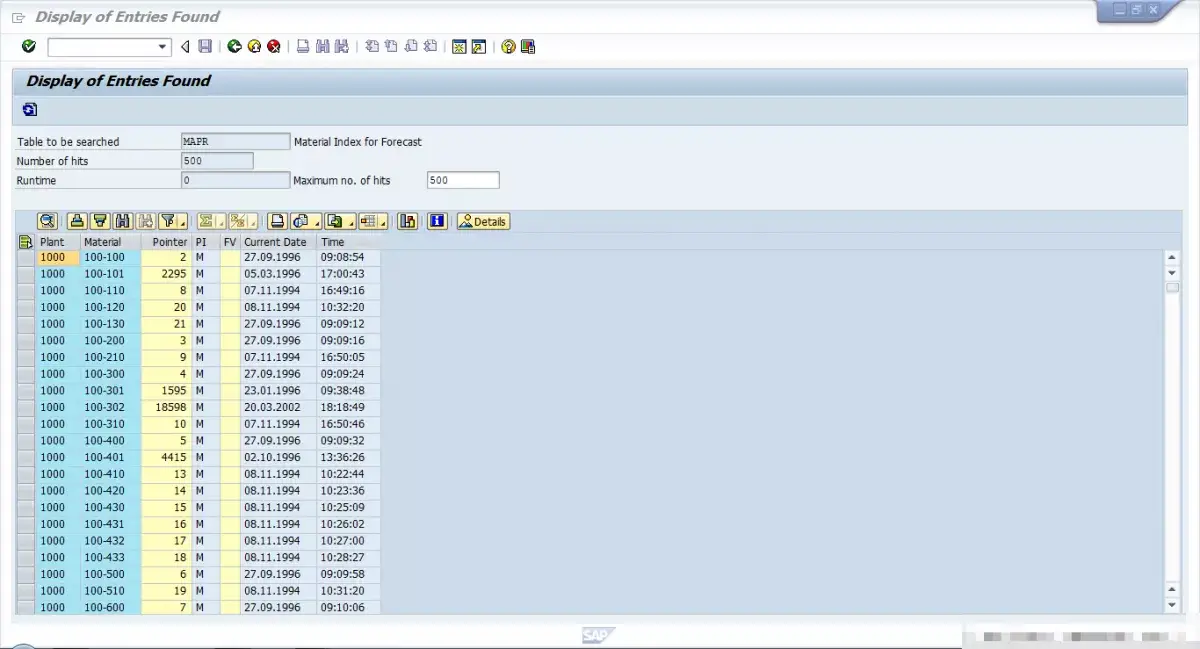
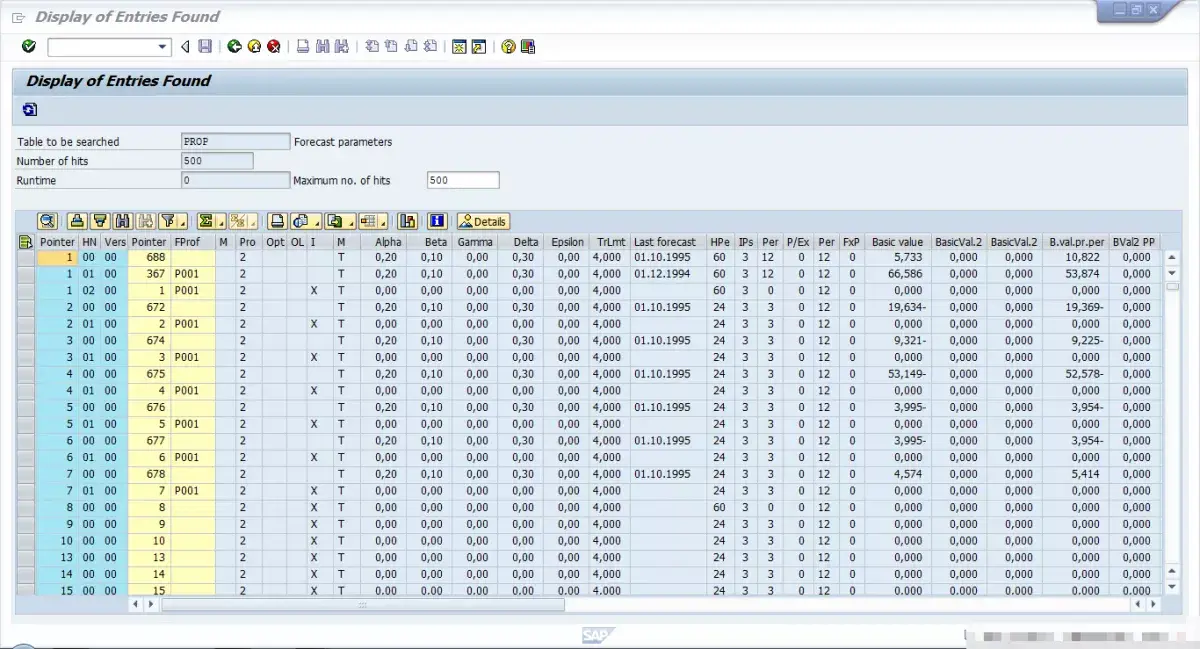
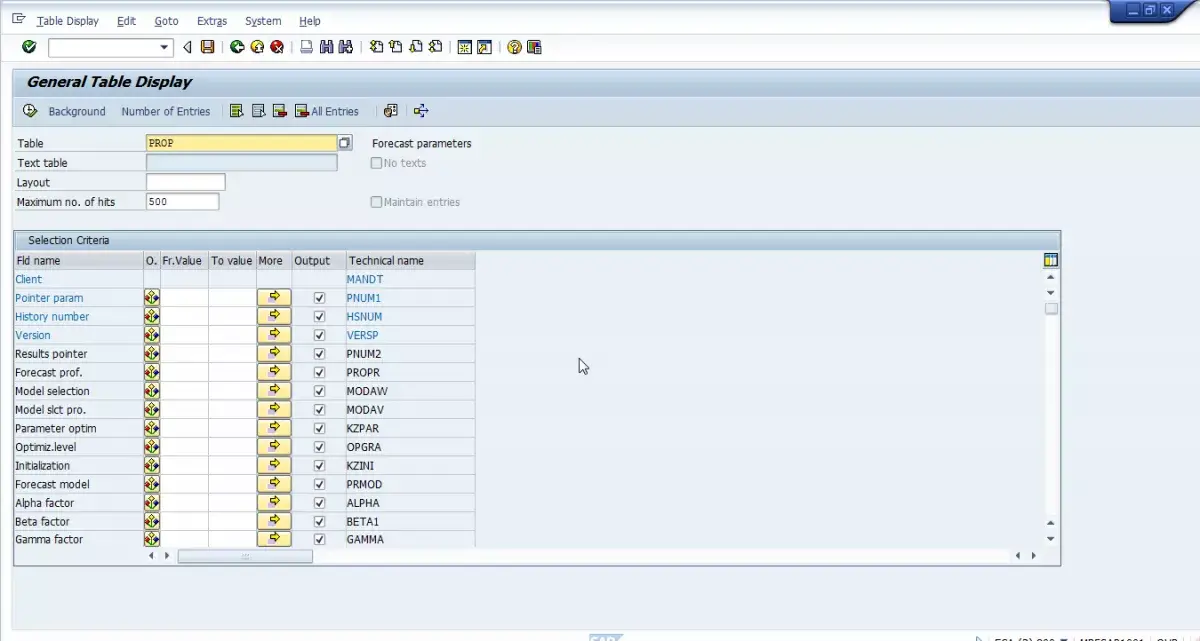
First, we must look for PNUM1 pointer corresponding to the Plant / Material in MAPR table (Fig 5), and, then, use it in PROP‘s table PNUM1 field (Fig 6), various Forecasting parameters versions will be detailed.
We finally have to select the highest History number, HSNUM parameter sequentially assigned, in order to get active forecasting parameters.
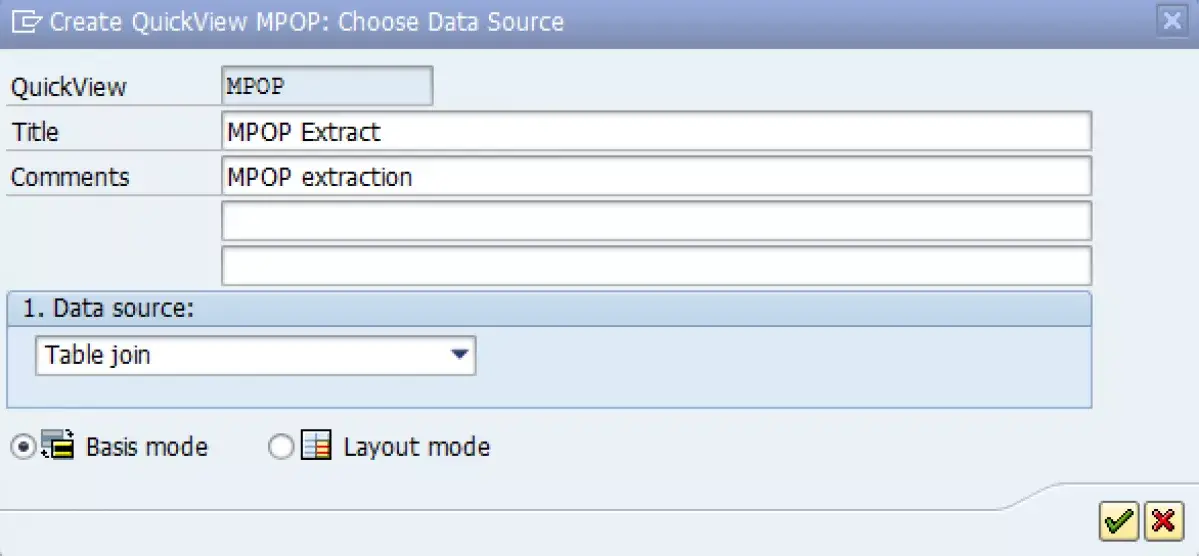
It is then quite simple, in SQVI, to create a Table join view, add tables MAPR and PROP, to display and extract our MPOP data.
These table keys might be useful in order to link the two tables MAPR and PROP together:
MAPR table - Material Index for Forecast (Fig 7) | |
| Plant | WERKS |
| Material | MATNR |
| Pointer parameters | PNUM1 |
PROP table - Forecast parameters (Fig 8) | |
| Pointer parameters | PNUM1 |
| History number | HSNUM |
| Version | VERSP |
PROP fields displayed by default in MM03 Forecasting view (Fig 4) and coming from MPOP :
Number of periods required | |
| PERAN | Historical periods |
| ANZPR | Forecast periods |
| PERIO | Periods per season |
| PERIN | Initialization pds |
| FIMON | Fixed periods |
Control data | |
| KZINI | Initialization |
| SIGGR | Tracking limit |
| MODAW | Model selection |
| MODAV | Selection procedure |
| KZPAR | Param.optimization |
| OPGRA | Optimization level |
| GEWGR | Weighting group |
| ALPHA | Alpha factor |
| BETA1 | Beta factor |
| GAMMA | Gamma factor |
| DELTA | Delta factor |
With an SQVI in SAP you will be able to see the SAP forecast table content by simply creating a table join and adding the two tables MAPR and PROP, and then executing the table join.
The layout can then be exported to Excel or as a text file, or be printed.
SAP Material Master forecasting view table extraction
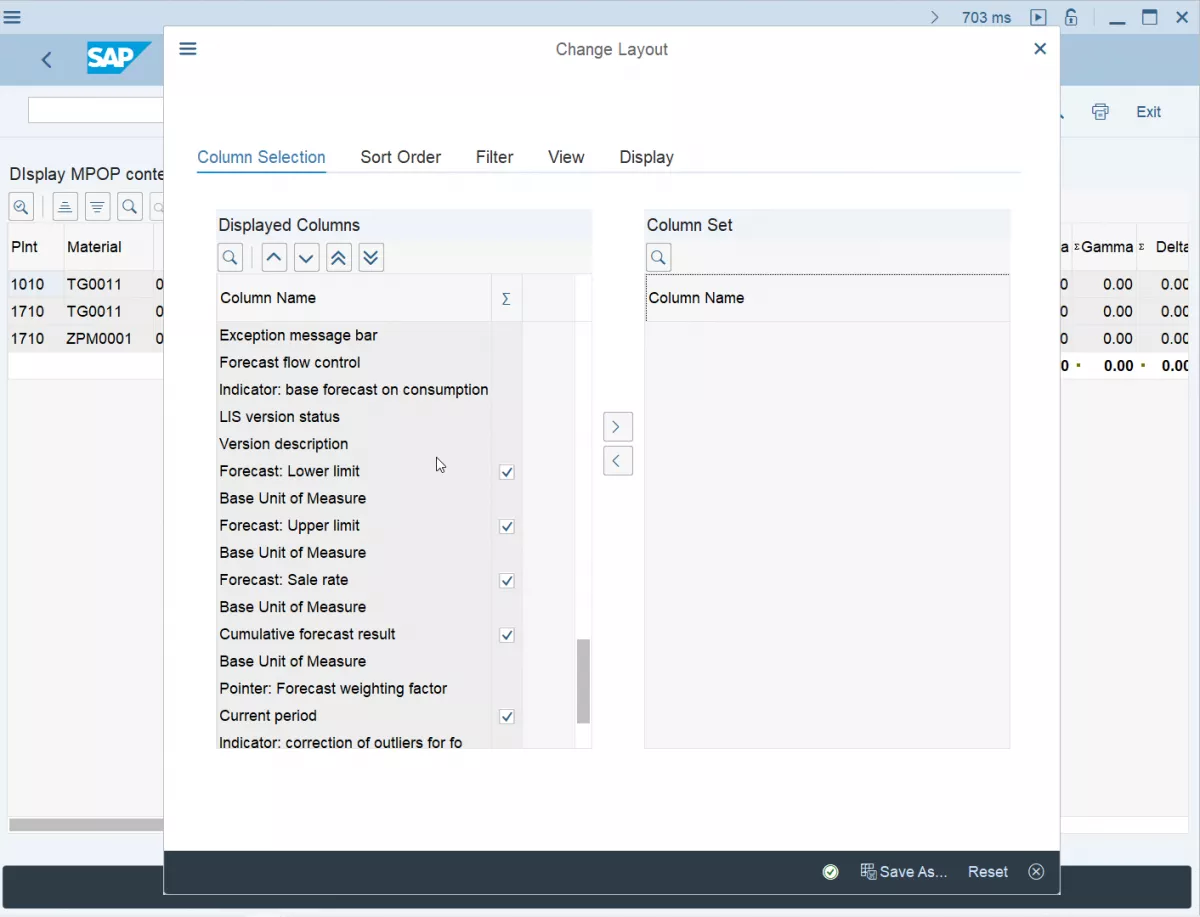
If too many fields are selected, you can change the ones displayed in the current export layout by changing the current layout and selecting the fields to be displayed from the SAP Material Master forecasting views table join.
For example, you might be more interested in the forecast lower limit and forecast upper limit fields, than in the fiscal year variant.
Selecting the right fields to display in the layout will also make it easier to print and share your SAP forecast table data extraction.
Frequently Asked Questions
- What is SAP MPOP structure and how is it accessed?
- MPOP structure in SAP is used for forecasting parameters and can be accessed through specific system transactions.
S/4HANA SAP Materials Management Introduction video training
Yoann Bierling is a Web Publishing & Digital Consulting professional, making a global impact through expertise and innovation in technologies. Passionate about empowering individuals and organizations to thrive in the digital age, he is driven to deliver exceptional results and drive growth through educational content creation.